Crazy Egg can give you insight into your web traffic like no other tool I know. It is not free after a thirty-day trial, but it is worth a look, and most likely going to provide a high return on investment even when you move to the paid plans.
- Go to the Crazy Egg page and click on a trial membership
- Enter your charge information and mark your calendar to cancel before the trial is up
- Enter the information to create a new snapshot, and we will go with the defaults for now
- Set the end date to your desired range (a few days or a week is good) and pick a maximum visits value
- You might be asked to copy a code snippet to your pages or install the WordPress plugin. Follow the instructions and verify the site is correct
- You can test your site by going to the dashboard (http://crazyegg.com/v2), logging in, selecting options under the dashboard menu item and clicking the Check Installation top menu item
- Enter your web address and it should come back as site verified
- Now come back when your snapshot is complete
- Check out the Confetti and Heat Map reports seeing exactly where your visitors are clicking and spending time
It takes some time for Crazy Egg to get you data, but when it does, you can now see how thorough it is. The reporting provides some great insights into how your site is used, viewed, and ways to improve conversion rates. If you have little traffic, then you will have to expand on your snapshot time frame. Our examples below do not have a lot of traffic, but still provide excellent insight.
Your first snapshot can form a baseline for testing site usability. Make some changes to buttons, images, and text and grab another snapshot. Even after a couple of these iterations, you will be well on your way to knowing your visitors in a way that can turn window shoppers into buyers.
The Crazy Egg Heatmap
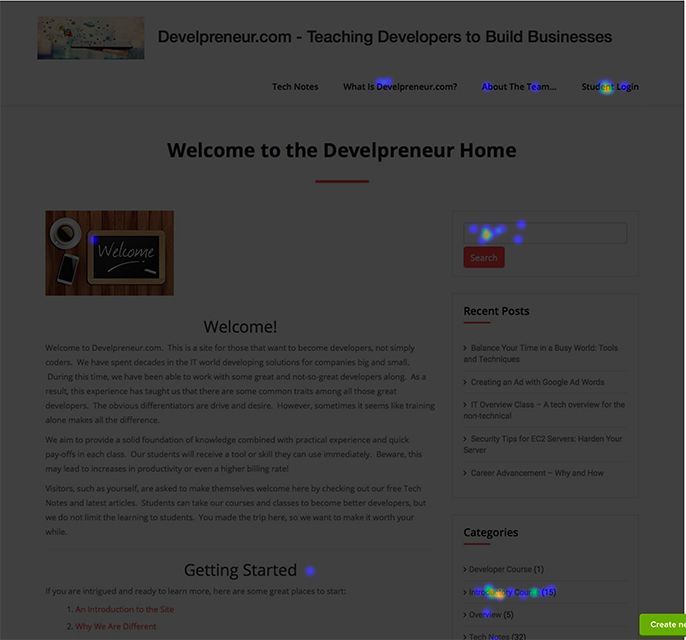
The heatmap shows where users are interacting with your page. In the above example, we see light activity on the header menus. The header link with the majority of traffic is the student login. This makes sense considering our user base. Some changes that we can look into from this report is to remove the Tech Notes menu option since it is never used. We also might want to move the Student login more up and to the left to make it more quickly visible.
On this page, the bulk of the navigation is done through the search field and the Introductory Course link on the side menu. The “Recent Posts” section is not touched so we can place that lower on the screen (or remove it) while moving categories higher up. We don’t have a large amount of data, but already we have some great action items to consider.
The Crazy Egg Scrollmap
We have two screen shots for the scrollmap. This is the top and bottom of the screen and shows us what our “above the fold” shows to visitors.

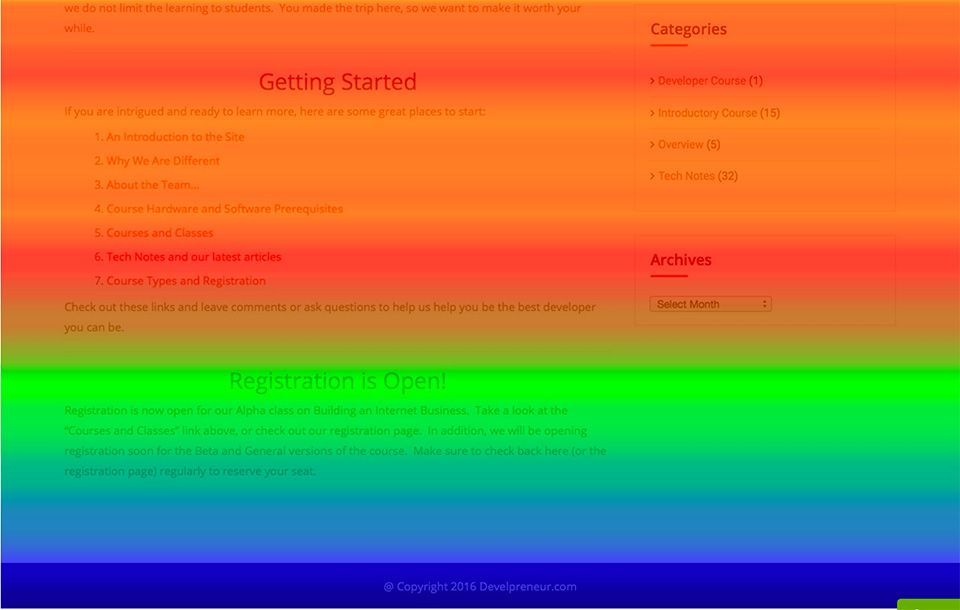
The white and bright yellow areas are where every visitor goes and the content they see. The green and blue are less and less viewed. In this case, we can see that the “Registration Is Open” portion of the page is not always seen. The scrollmap suggests we move that section towards the top of the page to ensure it is seen more often. In an ideal situation, a page will have the most important content and calls to action in areas that show white in the scrollmap.
Crazy Egg Confetti
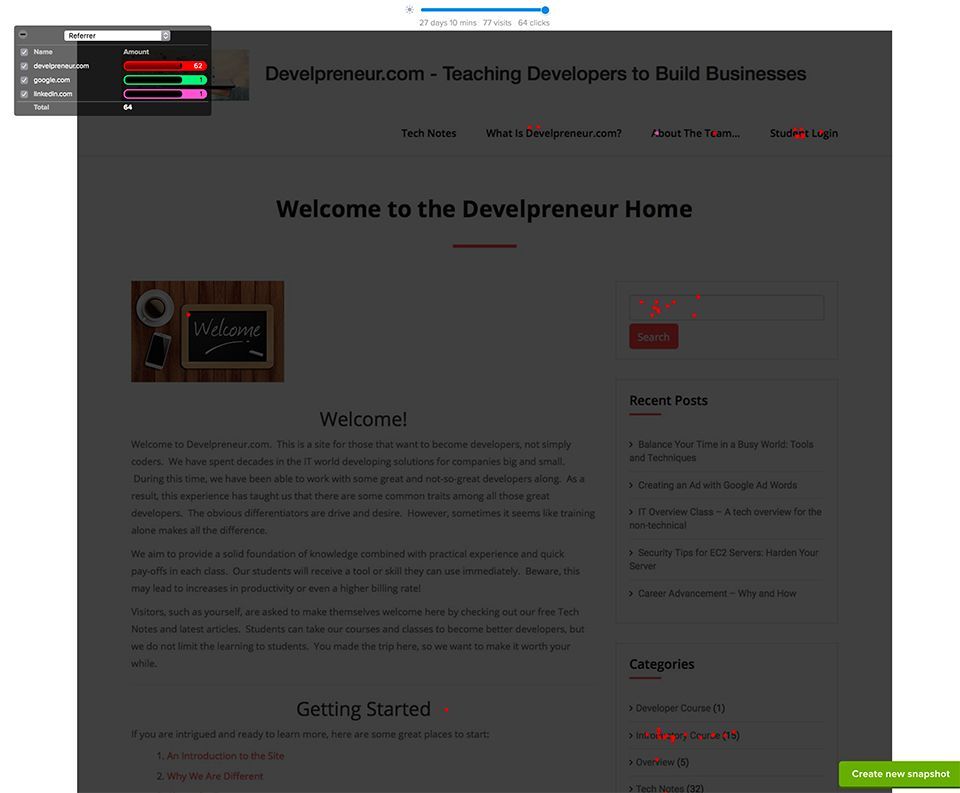
The confetti report is similar to the heatmap but shows every click. This report also includes the referring source for each click. The data is highly skewed in this report. We can see that only a couple of clicks came from places other than our site during this snapshot period. Other than that, this report backs up our possible changes noted in the heatmap section.
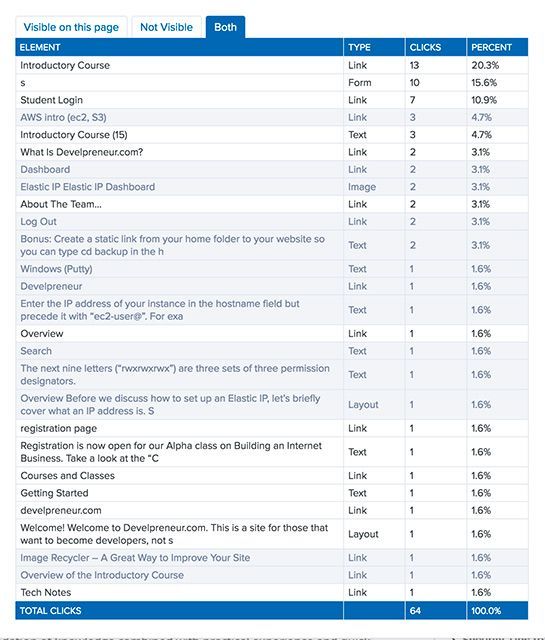
The Overlay
The last “report” we will look at here is the “overlay.” This report provides us the greatest detail in how visitors navigate the page. Note that this goes down to the link or page control level. For example, the second-row element listed only as “s” is the login form for students. The data from this report pairs with the heatmap and confetti to provide details about what users clicked and how often they did so.
CrazyEgg runs a little over $100 per year for the basic membership, but we fell it is money well spent. They also provide a short trial period that is worth it. If you go the trial period route, then wait until your site is live and seeing some regular traffic. The trial will provide the perfect information needed to plan out your post-launch changes and enhancements.
Click here to return to the Analytics class.
Further Reading
Website Optimization: An Hour a Day – A Conversion Rate Optimization and A/B Testing Guide
[sgmb id=”1″]