We have put our sites together and deployed them to our server. We have also configured our domain name and pointed it to our site. The next thing to do is to help people find our site. Accomplish this goal through analytics and measuring results.
There are many ways people might find our site. We can put our address on our business cards, tell people about our address, include the web address in our advertisements, make sure our site appears in search engines and get other websites to link to our site.
Our site is sort of like the voice of our business, and we need to find out how impactful and clear that voice and message is. To measure that voice we can analyze our site and how people respond to it. The stronger our voice and more direct our message, the more successful we are likely to be. Let’s look at some ways to measure that success.
What are the problems we want to solve by taking this class?:
- Is there a way of measuring site effectiveness?
- Can I generate site traffic other than through ads?
- What tools are available to measure site activity?
- How do I tell Google and other search engines about my site?
- How do I make my site more user and search engine friendly?
- What do I do with feedback from evaluations?
What we will cover:
- Analytics Overview
- Google webmaster tools
- Sitemaps
- Tools and sites for evaluating our website
- Adjusting course: Making changes based on feedback
- Improving Traffic
Class Goal: Students will have a sitemap built for their site and submitted to major engines as well as analytics configured for their site. They will also have a weekly analytics report sent to their mailbox
Web Analytics – Measuring Effectiveness
You may have heard of a thing called “web analytics” or “site analytics” and wondered what it is. Wonder no more. Analytics is what we call the various measurements used to determine how busy and useful a site is. The exact data we are measuring, and their names vary a little, but let’s take a look at the most common ones.
How busy is the site?
We start with the analytics that answers the question: “How highly trafficked is the website?” We can measure this in a few ways. The highest number (and obvious one) is simply to measure clicks on links in the site and requests to the web server. Click measurement may not give a picture that is detailed enough, though. Maybe we have one person that just likes to go to the site and click around rather than dozens of interested readers. We may also have clicks that are required by our design but falsely inflate click numbers. Sometimes this is referred to as click-bait. A simple example of this would be a top ten list that asks the user to click on a link to go from list item to list item. Thus, generating a dozen or more clicks from a single article.
Page Views
We can get a better traffic number by looking at page views. Page views is a measure that ignores clicks on the page that are not part of moving through our site and content. Instead, it chooses the more useful number, pages served. The number that not only helps with measuring user traffic, but it also shows how much work the web server needs to do regarding processing and network bandwidth.
There might also be a web crawler or robot that is traversing our site for a search engine and not a real visitor to the site. That brings us to the “users” metric where we measure the number of unique visitors to the site. Even when one person clicks on every page, they just count as one. The count is in contrast to potentially hundreds of users. We can add to this, session time and pages per session. These two values help us see how long people stay on our site, and how many pages they view on average. We want a high number of pages per session. However, e-commerce sites sometimes look for ways to reduce the number of clicks. Reduced clicks lead to quickly getting customers through product selection and a sale.
What do my users do on the site?
Next, there is the question: “What do my users do on the site?” Pages viewed, bounce rate and the previously mentioned session time help us answer the question. Bounce rate is a number that tells us how often (in percentage) we have a user that views one page and leaves. However, measuring single page traffic is another number that may or may not be important depending on the site.
Here are a few examples:
- A learning site should have a low bounce rate
- Sites with only one page that matters will have a high bounce rate
- Drawing users to a single article at a time will also result in a high bounce rate. However, you probably want to find ways to get them to view other pages as well.
When session time is high, and bounce rate is high, then you have people coming for the content on that page and little else. The bounce is either because you offer no other action, or you absorb all their time in that one page/article.
Pages Viewed
Pages viewed tells us what pages the user visits. We often also can view flow metrics to help us see where users typically start their visit to our site and where they drop off. Page views can be critical data for goals such as measuring sales conversions. If you have a tight process for checkout and a single page often is the last step before users leave (and it’s not “thanks for purchasing”), then you know something about that page is turning people away. Fix the page to get to that all important sale.
When you have a content site, then page views points to what your most read posts are. Use this stat to drive content. It also is useful when you refine titles, images, keywords and other specifics about your articles and their presentation.
Who are my users?
The next group of analytics focuses on answering the questions “Who are my users?” We have sections named technology, traffic, demographics, and referrers to address this data. Technology tells us what browsers users are on when the visit our site. Technology may point to many users of mobile devices or maybe a Mac-centric customer base. It tells us what browsers and versions we should use to test our site and applications.
Sometimes our site does not look right in a particular browser. Therefore, if a majority of our users visit with that browser, it can make it look like our content is erroneous when it is simply a display bug. Look across browsers is worth reviewing periodically at least.
Traffic and referrers tell us where our users are from. Traffic is a sort of summary metric that tells us whether we get visitors from search engines, social networks, direct links or other. The referrers metric takes this down a level to tell us what sites are sending us traffic. This data is useful to direct us where we can refine our social network presence. It also can point to websites where we want more visibility.
Demographics is the best information about our visitors. It can include gender, age, geographical location, and sometimes more data. Demographics tell us who our audience is and maybe even what they like. Thus, it should be reviewed regularly and included in our vision and planning. This data can also direct us towards specific products and content for our site, showing us where we could focus growth. For example, we might find that middle age moms are a significant portion of our visitors. In this case, we would adjust our ads to be focused more on products that appeal to them.
The Four Questions
There is more analytic data out there to be reviewed, but this gives us a start on its purpose. Web analytics is all about answering questions about our site including:
- How busy is my site?
- Who are my visitors?
- What do my users do on the site?
- What brings visitors to my site? (or turns people away)
Google Tools
Google has a reach that touches all of the Internet. They offer great tools to help you get your content in front of the people that will find it most appealing. Let’s dive into those tools. Sign up for analytics and get it built on our site:
Now that we have it configured let’s look at some of the data Google provides us. We will focus on the reporting for now. Login to Google Analytics (analytics.google.com) and click on the “Reporting” tab to follow along.
Home Page
The Reporting home page has a dashboard of our recent site activity. You can click a button on the top right to quickly look at hourly, day, week, and month data. The graph at the top is used to compare various metrics in a visual way. As we move down the screen, there are several key indicators for our site: Sessions, Users, Page Views, Pages/Session, Avg. Session Duration, Bounce Rate, and % New Sessions. That last value is one we have not yet discussed, and it is a measure of the percentage of new users to our site (as opposed to returning users).
Scan a little further down the page to see sections for Demographics, System, and Mobile. Click on any of the attribute links in this section to see a breakdown of the data for that attribute for the time frame you selected at the top. Take a minute and check out the breakdown of your traffic, if you have had any.
The Menu Options
A menu is available down the left side of the screen. The options alone show involved analytics can get. Fully using these features is a course in itself, but let’s take a quick tour. First stop is the Dashboards menu. You can create a custom dashboard by clicking on the New Dashboard Link. Let’s do that now. When you click on the link, you will see an option for a blank canvas or Starter Dashboard. Click on the Starter Dashboard and enter a title. Click on Create Dashboard and you will see a great dashboard within seconds. This report provides a view of your traffic for the last month (by default).
Let’s customize our dashboard. Click on the Customize Dashboard link at the top right. You will have the option to change the display. Pick a configuration that suits your desires. We can delete revenue and goal completions for now. Do this by hovering the mouse over each widget and clicking on the X link at the top right of the widget. You will be asked to confirm the deletion.
Customizing the Dashboard
Click on the Add Widget link at the top left of the dashboard.
- Set the title to Page Views
- Click on The timeline button on the Standard row (not Real Time)
- Select Page views from the Add a metric drop down (start typing Page to jump to the selection)
- Click Save
- Scroll to the bottom to see the widget
- Click and drag the widget to drag it to the top left of your dashboard
Now let’s make sure we keep ourselves reminded of the stats:
- Click on the email button at the top of the dashboard
- Enter your email address in the To field
- The dashboard name is the subject of the email sent
- Set your frequency to weekly, and pick a day of the week
- Provide some text for the body of your email
- Click save. Your weekly reports will start showing up in your mailbox
Before leaving this section, take a few minutes to look at the other options available on the left menu. The dashboard is worth returning to regularly as your site gets more and more traffic. You can also find a lot of articles and books to help you fully utilize analytics.
Site Maps
Analytics help with measuring our site, but we also want to make sure we are as search friendly as possible. Registering our site and submitting a sitemap is a great way to get known by Google. We start by registering our site at Google:
- Go to webmaster tools (login if needed)
- Click on Add Property
- Enter your website address and follow a verification step (Google Analytics is easiest)
- Click on Search Console and then Add Property
- Add your address without the “www” at the start (or with if you did not the first time
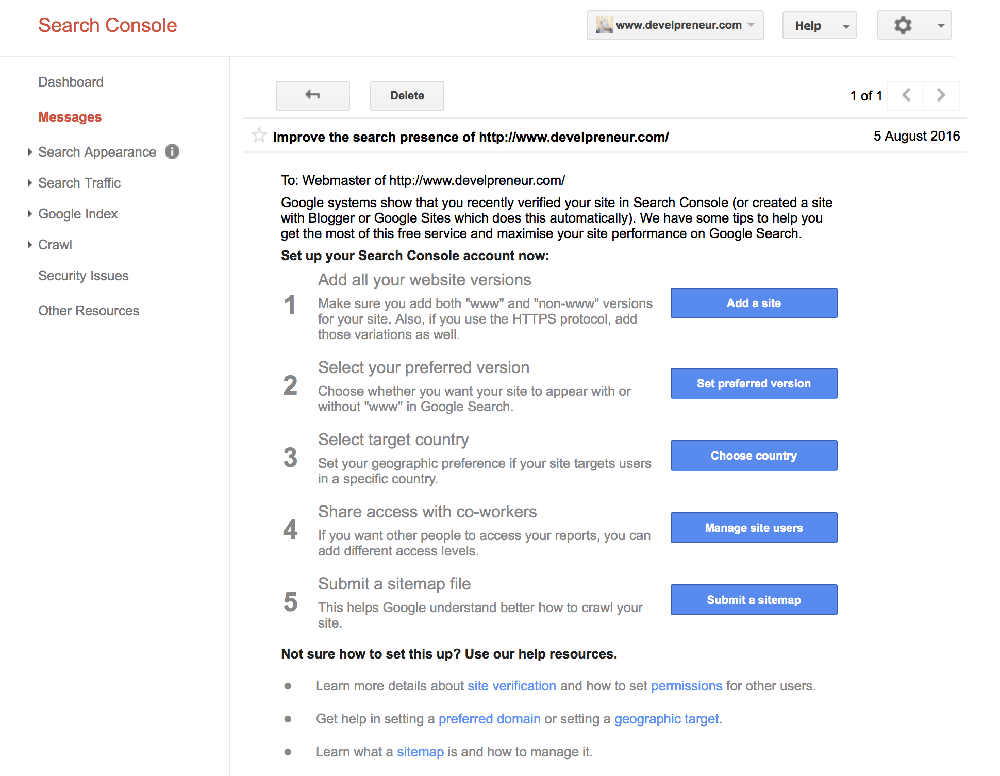
- Go to your messages and click on the buttons to improve your site (in the “improve your search presence” message)
- Before submitting a sitemap, we need to create one: Go to https://www.xml-sitemaps.com to create one quickly.
- Change the frequency to weekly (daily if you blog that often)
- Leave the time to use server’s response
- Set priority to auto calculate
- Download the sitemap.xml file and place it on your website at the root
- Return to the message about how to improve our site and click on submit a sitemap
- Click on the Add/Test Sitemap button. A window to enter the location for your sitemap will open.
- Enter sitemap.xml (you should already have your site address filled in by Google) and click submit
- Refresh the page (as requested). Now you will see a graph of the number of pages you have submitted
- Now start to look at some of the options on the left menu, but most of them will not show any data until at least 24 hours after you have submitted your sitemap.
Next Steps
At this point, we have told Google our site exists and asked them to help us help them when our site would be a good option to appear as a search result. The Webmaster and Search console tools are very powerful and worth learning in detail. Unfortunately, we are not going to tackle them in this class. We have also focused only on Google. Google provided tools are far beyond other search engines. However, sitemaps are commonly used to get your site “listed” with a search engine and started with their tools. Take a look at how to submit your sitemap to other engines like Bing to expand your presence.
We have what we need for now to measure how our site does and can look at ways to evaluate and improve our site.
Site Evaluation Tools
Search engines each have their own unique (and secret) way to evaluate sites and score them for how high they show up in search results. The exact formula is a well-kept secret, but there is a lot that they provide to help you conform to how they feel sites should work. It can take months or maybe years to dig through all of the details and match our site against them, but fear not. There are plenty of tools available to help you evaluate and improve your site. Many are free in some capacity, and there are enough of them out there to find one that matches how you work and your level of technical skill. The value of showing up on the first results page for a search makes all the effort worthwhile.
The most general guidelines for sites to comply with are accessibility guidelines. These guidelines are to be followed to make your site friendly to scanners, crawlers, and readers. Follow accessibility guidelines to show you are “playing nice” with the Internet. These guidelines include designing your website so that it is accessible to everyone, even the blind. Accessibility also impacts mobile device support and many other non-traditional web access methods. We will not go into this in depth here, but you can find a tool to help you out by picking from this list provided by the W3 Internet standards organization:
https://www.w3.org/WAI/ER/tools/
Analyzer Tools
The deeper steps into improving your site can be determined from site analyzer tools. You can search for these (or check out the list in the further reading section) to find a tool or tools that work for you. We recommend two specific tools for you to review just to get a taste for what sort of analysis is available. The two tools we are going to look at in depth are: screaming frog and crazy egg. Yes, the names are odd, but the functionality is invaluable. Both of these tools have a paid and free version. Crazy Egg provides a 30-day trial, while Screaming Frog has a limited functionality free version. The paid version adds features for tracking changes over time. The free version of Screaming Frog is used in this class. Review the paid features to determine if it is a good fit for your site.
Getting Started with Screaming Frog
Getting Started with Crazy Egg
Before we move on, let’s go back and look at some more ways to use Screaming Frog. The tool can teach you how to make a better site. All you have to do is walk down the folders on the right side under the SEO Elements folder. We have talked about response codes a little, so let’s move down to Page Titles. Every page on your site should have a page title (the title tag in HTML). Usability studies have shown that titles are best at six to seven words in length and less than 65 characters in length. This length ensures the page title will show entirely in the Google search results. Reduce duplicates to help distinguish between your site pages.
Description and Keywords
Meta description and keywords help search engines categorize your site. The ideal description is around eighty to one hundred forty characters and should be a summary of the page content that sells it to potential readers. Keywords should be four to six words that would be great search terms for your page content. Do not spam the keywords section with dozens of words. Also, do not use single and plural versions (shoe shoes) of a word. All of your pages should always have both meta keywords and descriptions.
Headers (H1, H2, etc.)
Beyond the meta description and keywords, the headers (H1 and H2) are used to help categorize content. As you create content, use header and other tags properly to layout the content in a way that is easy for readers to follow. These two folders will help in achieving this goal. Try to keep headers shorter than seventy characters to help their display in search results. Avoid repetition of headers across content as well. Repetitive headers make it look like you have written the same thing over and over rather than a lot of unique content. The uniqueness of content is an important part of Google’s page ranking.
Once you have worked through these sections, run the tool against your site again. Repeat until you have a site that follows all the best examples. Following guidance from tools will not guarantee success, but following the rules will help your site look better in search engines. If that little bit of improvement pushes you to the first page of search results (instead of the second or worse), that can mean the difference between success and failure.
Improving Your Site
Now that we have evaluated our site, we should have a list of things to do to improve it. If you do not, then you did it wrong. Little things get missed in creating a site, but the tools help track them down. A short list is improved by looking deep into evaluation results. The deeper inspection will provide new areas for improvement. I have always been a fan of cyclical improvements like this to perfect software of any kind. In the case of a website, it sometimes helps to “bake in” the changes to ensure you do not drive visitors away and that you have not broken something while making your latest fix.
You want to steadily improve your site. However, you need to do this without driving away users. Thus, let’s look at some ways to accomplish that goal.
- Create a back-up/development/test site where you can try out any changes. With analytic information, it sometimes helps to have a domain address that points to it so you might have mysight.com and testing.mysite.com
- Pick slow or dead times for your site changes. This will minimize the negative impact
- Start each maintenance cycle (week, month, etc.) with a review of what the evaluation tools point to as areas for improvement
- Build a list of changes you will make this cycle. It helps to group changes so you can focus on a single area at a time. I usually start with headers and footers that impact all users and work from high traffic pages towards pages that have less traffic
- Check the changes out in more than one browser and screen size. Chrome is great, as you can drag the size of the screen and quickly see how the site responds from desktop sizes down to mobile phones
- Before you deploy changes to your main site, backup the site and databases. Thus, you will have the option to restore your site to the working state. You never know what might go wrong. A backup never hurts
- Complete your changes then take a trip through your site to make sure everything still works as expected.
Improving Traffic
As we improve our site through evaluations and the resulting suggestions, we also want to see an increase in traffic. Let’s look at some less technical ways to improve traffic:
- Regular content: If you have new content available for users on a regular basis, they are more likely make repeat visits to your site. Search engines also will be more current with your content when you provide it on a regular basis
- Provide links: Make sure your emails, posts, and social networking profiles all have references back to your site(s). The more your name gets out there, the more likely people are to see it
- Match Content to Audience: Keep an eye on how your content is received. You might have certain topics and formats that receive better traffic than others. The traffic may be due to marketing efforts, but more often is due to title and topic selection. Even related images can make a difference in whether someone clicks to read your article or visit your site.
- Trial and Error: Do not be afraid to re-post your content. Try out changes like title size/placement, color adjustments, wording on buttons, ad placement, and more to arrange your site so that it optimizes your chance to get a sale and to bring people back to your site
- Ask for Feedback: Even a small response rate can provide a big payoff when you ask for feedback on your site. Ask your mother or best friend if you have to, but regular users of your site are the ones whose opinions matter most. Provide a way for readers to give feedback as comments or emails. Thus, you can keep their wishes in mind.
- Have a plan: Random testing doesn’t help. Pick a theory or approach, and test it out. For example, you might find that people are visiting your product page, but not purchasing enough. Your plan could be to move around the “buy now” button, change the color, and even the font and wording. Setup the configuration to test, make the changes and give it time to measure whether the change helped or not. A week of data provides all the measuring needed for typical sites.
Assignments
- Configure your website and WordPress to work with your analytics account
- Download and run Screaming Frog against your website
- Create a fix-it list with five items you can do on your site to improve it
- Build and submit a sitemap to Google for your marketing site.
- Create your Bing account and submit your site there as well
Bonus: Research and configure a goal for your site in Google Analytics. Add that goal to your dashboard report.
When you are ready, it is now time to move on to the next step: Work Sites and Bidding – Turning Skills into Revenue.
Further Reading
Outside of additional classes here, we have found these sources to be excellent for learning more about analytics and how to use them to strengthen your site:
Google Analytics for Beginners
Learning Google AdWords and Google Analytics
[sgmb id=”1″]